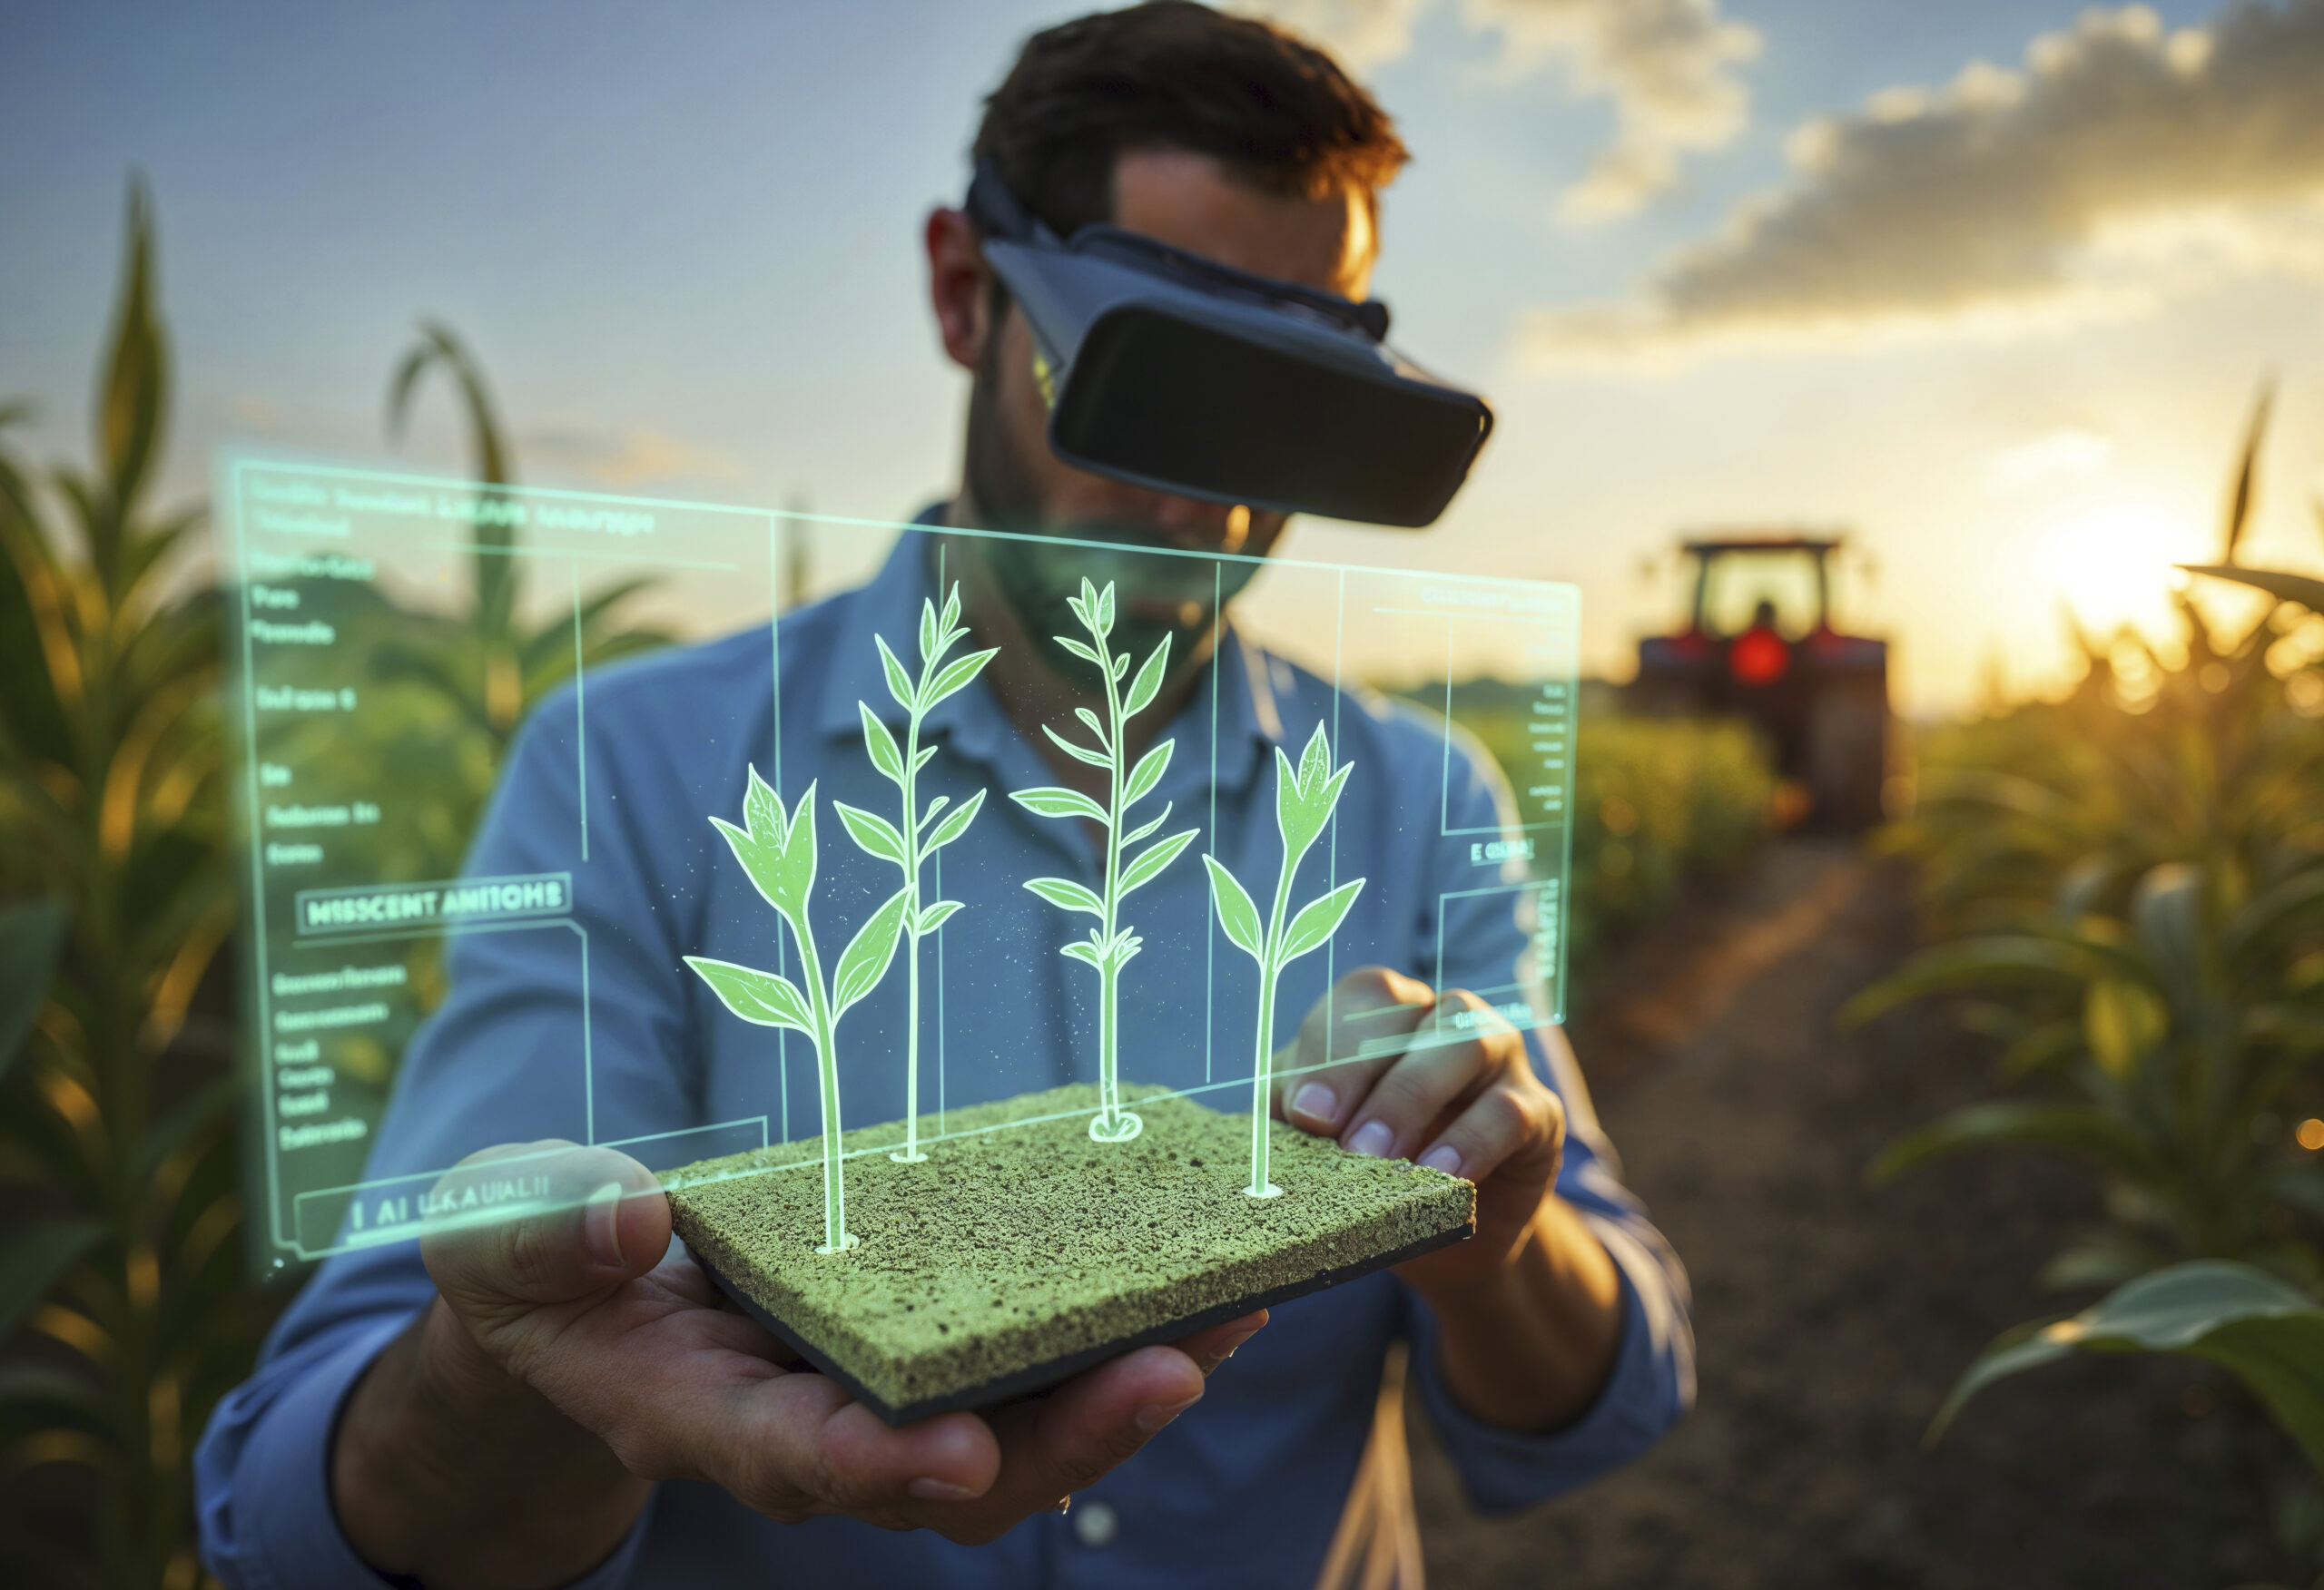
Smart agriculture, powered by Internet of Things (IoT) technology, has rapidly transformed traditional farming practices. According to a report by MarketsandMarkets, the global IoT in agriculture market size is expected to grow from USD 14.7 billion in 2020 to USD 34.1 billion by 2026, with a compound annual growth rate (CAGR) of 15.2%. The increasing demand for food, coupled with the need for sustainable practices, has made smart farming technologies essential. A key component in the success of IoT-driven agriculture is the IoT monitoring dashboard, which aggregates data from sensors, devices, and systems across the farm.
These dashboards provide farmers with real-time insights, enabling them to make informed decisions. In this article, we’ll explore the development of IoT dashboards for smart agriculture, focusing on the key metrics that matter most and how effective IoT dashboard solutions can enhance operational efficiency.
Table of Contents
What is an IoT Monitoring Dashboard?
An IoT monitoring dashboard serves as a user interface that visually represents data collected from various IoT sensors and devices installed on a farm. These dashboards help farmers monitor the performance of their crops, livestock, equipment, and environmental conditions in real time.
Key Components of an IoT Dashboard
- Data Visualization: Graphical representation of data through charts, graphs, maps, and gauges.
- Real-Time Monitoring: Live updates of sensor data for immediate insights.
- Alerting System: Notifications or alarms triggered when a parameter exceeds or falls below a preset threshold.
- Data Logging: Historical data storage for trend analysis.
- User Interaction: Customization options that allow farmers to adjust settings and preferences.
Key Metrics for Smart Agriculture IoT Dashboards
The effectiveness of an IoT dashboard hinges on the quality and relevance of the metrics it presents. The following metrics are critical for ensuring the optimal functioning of a farm.
1. Soil Moisture Levels
Soil moisture is a key indicator of crop health and irrigation needs. Sensors placed in the soil measure moisture content at different depths, allowing farmers to determine when and where irrigation is necessary. An IoT dashboard can visualize soil moisture data over time, helping farmers optimize water use, which is crucial in water-scarce regions.
Key metrics to display:
- Current moisture level
- Optimal moisture range for specific crops
- Soil moisture trends over time
2. Temperature and Humidity
Temperature and humidity play a vital role in the growth and productivity of crops. These environmental factors affect photosynthesis, transpiration, and pest activity. An IoT dashboard can aggregate data from temperature and humidity sensors and present them in an easy-to-understand format, such as heatmaps or time series graphs.
Key metrics to display:
- Current temperature and humidity readings
- Ideal temperature range for crops
- Historical temperature and humidity trends
3. Crop Health Monitoring
Crop health is increasingly monitored through IoT-connected sensors, drones, and imaging systems that detect anomalies in plant growth. These systems track parameters such as chlorophyll levels, leaf temperature, and vegetation indices. An IoT dashboard that visualizes this data can help farmers identify early signs of disease, pest infestations, or nutrient deficiencies.
Key metrics to display:
- Vegetation Index (NDVI)
- Crop temperature
- Chlorophyll content levels
4. Weather Forecasts
Real-time weather data integrated into an IoT dashboard allows farmers to plan better for upcoming changes in weather conditions. With accurate forecasts, farmers can make decisions regarding planting, irrigation, pest management, and harvesting. For example, knowing when a rainstorm is expected can help in scheduling irrigation or protecting crops from weather damage.
Key metrics to display:
- Short-term and long-term weather forecasts
- Alerts for severe weather conditions (frost, hail, storms)
- Historical weather patterns
5. Livestock Monitoring
For farms that include livestock, IoT sensors can track the health, location, and activity of animals. Wearable devices, GPS trackers, and biometric sensors can help farmers monitor key health indicators like heart rate, body temperature, and activity levels. This data can be displayed in real-time on the dashboard, allowing farmers to identify potential health issues early.
Key metrics to display:
- Animal activity levels (movement, feeding, etc.)
- Heart rate, body temperature, and other vital signs
- GPS location of livestock
6. Irrigation System Monitoring
Water management is one of the most critical aspects of modern farming. IoT-enabled irrigation systems use sensors to detect soil moisture levels and control irrigation schedules automatically. By integrating irrigation data into the IoT dashboard, farmers can track the system’s efficiency, ensuring that water is used only when needed.
Key metrics to display:
- Water usage per field or crop
- Irrigation schedule
- Efficiency of the irrigation system
7. Energy Consumption
Many smart farms use IoT-based solutions for energy management, including renewable energy sources like solar panels. By integrating energy consumption data into the dashboard, farmers can monitor energy usage, identify inefficiencies, and reduce costs.
Key metrics to display:
- Total energy consumption
- Energy use per device or system
- Solar energy generation (if applicable)
Visualizing IoT Data: Key Visual Elements
The effectiveness of an IoT dashboard lies in its ability to present complex data in a clear and understandable format. Here are some common visual elements used in smart agriculture dashboards:
1. Real-Time Graphs and Charts
Line graphs, bar charts, and area charts help to visualize time-based data like soil moisture trends or temperature fluctuations. These charts are essential for spotting patterns and identifying irregularities at a glance.
2. Heatmaps
Heatmaps can represent spatial data, such as soil moisture levels or temperature variations across different sections of a farm. By color-coding data points, farmers can quickly spot areas that need attention.
3. Geospatial Mapping
IoT data can also be represented on geographical maps, helping farmers monitor sensor data across the physical layout of their farm. GPS-based geospatial mapping can display the exact location of crops, livestock, or devices.
4. Real-Time Alerts
Notifications or alarm systems that trigger when specific thresholds are crossed (e.g., a sudden drop in soil moisture or a spike in temperature) are essential in a smart farming environment. Alerts help farmers take immediate action to prevent damage or loss.
5. Historical Data Trends
Providing farmers with access to historical data trends enables them to analyze past performance and make future predictions. Dashboards can display this information through graphs or tables, helping farmers make informed decisions for the next planting season or irrigation schedule.
Developing IoT Dashboards for Smart Agriculture
The development of an IoT dashboard for agriculture requires a combination of hardware, software, and user-centered design. Below is an overview of the key steps involved in creating a successful IoT dashboard solution for smart farming.
Step 1: Define the Objectives
Before development begins, it’s crucial to identify the primary objectives of the dashboard. Are the main goals to monitor soil health, optimize water usage, track livestock, or all of the above? Understanding the farmer’s needs helps in selecting the right IoT sensors, defining metrics, and designing the dashboard’s user interface.
Step 2: Select IoT Sensors and Devices
The next step is selecting the appropriate IoT sensors and devices. These could range from temperature and humidity sensors to soil moisture probes, GPS trackers, and drone-based imaging systems. The sensors need to be reliable, durable, and capable of providing the necessary data for the dashboard.
Step 3: Data Integration and Connectivity
Once the sensors are in place, the collected data needs to be aggregated into a central platform. Data integration requires setting up communication protocols (e.g., MQTT, HTTP, or LoRaWAN) that ensure smooth data flow from the field to the dashboard. Connectivity should be stable to avoid any loss of critical information.
Step 4: Develop the User Interface
The user interface (UI) is the most critical component of an IoT dashboard. A clean, intuitive UI ensures that farmers can easily interpret data and take appropriate actions. The design should prioritize simplicity, making it easy for users with minimal technical knowledge to navigate and make decisions quickly.
Step 5: Implement Data Analytics and Visualization
Data analytics algorithms can process the collected data and provide predictive insights, such as crop growth forecasts or potential equipment malfunctions. Visualization tools should include customizable graphs, charts, and geographic maps to offer clear, actionable insights.
Step 6: Testing and Deployment
Finally, the dashboard needs to be thoroughly tested in real-world farm environments. Feedback from actual users is essential to identify potential issues and improve the system. Once finalized, the dashboard is deployed to the farm, and continuous monitoring and updates ensure optimal performance.
Benefits of IoT Dashboard Solutions for Smart Agriculture
The adoption of IoT dashboard solutions in smart agriculture provides numerous benefits:
- Improved Decision-Making: Real-time data helps farmers make quicker, data-driven decisions.
- Resource Efficiency: By optimizing water usage, energy consumption, and crop care, farmers can reduce costs.
- Increased Crop Yields: Precise monitoring of crop conditions leads to better yields and quality.
- Reduced Environmental Impact: IoT dashboards help farmers reduce water wastage and chemical use by optimizing irrigation and pest management.
Conclusion
In conclusion, IoT dashboard solutions are essential tools for modernizing agriculture, enhancing farm management, and promoting sustainability. By offering real-time insights into key metrics like soil moisture, temperature, crop health, and livestock monitoring, these dashboards empower farmers to make informed decisions. With the continued growth of IoT technology in agriculture, the future promises even more advanced solutions that will help farmers optimize their practices and address the challenges of a rapidly changing environment. As IoT systems evolve, the capabilities of dashboards will expand, providing even more detailed and predictive insights that drive efficiency, sustainability, and profitability.
For More Informative Blog Visit Here: https://efullforms.com/


